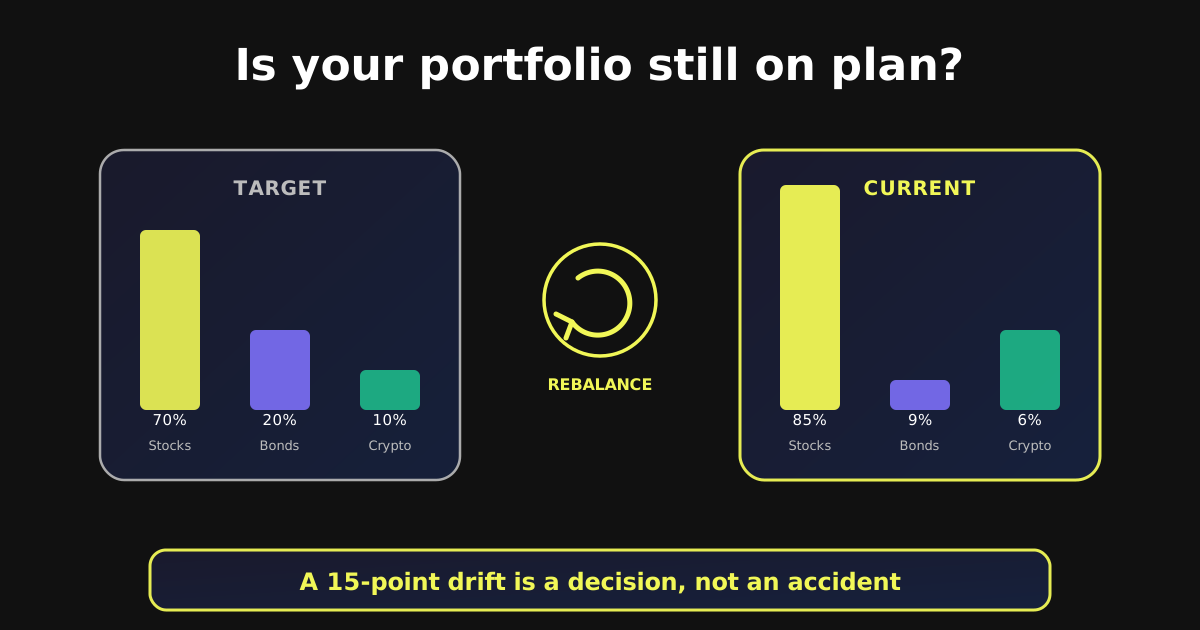
Rebalancing has a branding problem. It sounds like homework — something disciplined investors do on a spreadsheet once a year, out of duty rather than need. In reality it's one of the few portfolio actions with a genuinely mechanical case behind it: sell some of what went up, buy some of what didn't, and your risk level stops silently drifting away from the one you actually chose.
The harder question isn't whether to rebalance. It's when — because rebalance too often and you're paying costs and taxes to fix drift that wasn't a real problem yet. Rebalance too rarely and your "balanced" portfolio quietly turns into a much riskier bet than you signed up for.
Why Portfolios Drift Even When You Do Nothing
Drift isn't a mistake. It's just math. If you start at 70% stocks and stocks return 25% in a year while your bonds return 4%, stocks now make up a noticeably bigger slice of the total — not because you bought more, but because they grew faster.
Winners Grow Into Bigger Risk
This is the part that catches people off guard: the position that's been carrying your returns is, by definition, the one taking up more and more of your portfolio. A great run in crypto or a single tech stock doesn't just add to your gains — it quietly increases how much any single reversal can cost you.
"Doing Nothing" Is Also a Decision
Every year you don't rebalance, you're implicitly making a new, bigger bet on whatever has been winning. Sometimes that's the right call — trends can persist. But it should be a decision you're making on purpose, not one that happened to you because checking the numbers felt like a chore.
Two Honest Ways to Decide When to Rebalance
There's no single correct rule, but almost every reasonable approach falls into one of two camps.
Threshold-Based: Rebalance When Drift Crosses a Line
You pick a tolerance — commonly 5 percentage points — and only rebalance when an asset class strays further than that from its target. If your target is 70% stocks and you're sitting at 74%, you leave it alone. At 76% or beyond, you act. This approach reacts to what's actually happening in your portfolio instead of the calendar, and it naturally rebalances more often in volatile years and less in calm ones.
Calendar-Based: Rebalance on a Fixed Schedule
Simpler to stick to: check and rebalance every quarter, every six months, or once a year, regardless of how far things have drifted. The tradeoff is you might rebalance when drift is trivial (wasting a trade) or leave a large drift sitting for months before your next scheduled check.
Most people do best combining the two: check on a calendar cadence (so it actually happens), but only act if drift has crossed a real threshold (so you're not trading noise).
What Rebalancing Actually Costs You
Rebalancing isn't free, and pretending otherwise leads to overtrading. Two costs are worth weighing before you act:
- Taxes on realized gains — selling your winners to buy your laggards usually means realizing a capital gain, which can trigger a tax bill depending on your country and how long you've held the position. A tool like Watchfolio's Tax Estimator can show you roughly what a sale would cost before you commit to it.
- Transaction costs and spreads — smaller with modern low-fee brokers, but not zero, especially for crypto or less liquid positions.
This is exactly why threshold-based rebalancing tends to beat rigid calendar rebalancing for most people: it only pays these costs when the drift is large enough to be worth fixing.
How Watchfolio's Rebalancing Tool Works
This is the part most portfolio apps skip entirely — they'll show you a pie chart of your current allocation and leave the rest to you. Watchfolio's Rebalancing tool goes a step further:
Set Your Target Allocation Once
Define target percentages for stocks, bonds, crypto, and cash. This becomes your reference line — the plan you're actually comparing against, not just a vague sense of "roughly balanced."
See Current vs. Target, Side by Side
Every asset class gets a progress bar showing your current allocation against a marker for your target — so a 4-point drift and a 20-point drift are instantly, visually different, instead of buried in numbers you have to do mental math on.
Get Exact Dollar Amounts, Not Just Percentages
Instead of leaving you to convert "you're 6 points overweight stocks" into an actual trade, the tool tells you exactly how much to buy or sell in each asset class to get back to your target — pulling real numbers from your actual holdings across stocks, crypto, and bonds.
Stop eyeballing your allocation
Set a target once, and see exactly how far you've drifted — and exactly what to buy or sell to fix it — any time you check in.
Create Free AccountFree plan available. No credit card required.
A Quick Example
Say your target is 70% stocks, 20% bonds, 10% crypto on a $50,000 portfolio. A strong year for stocks and crypto — and a flat one for bonds — leaves you at 82% stocks, 9% bonds, 9% crypto. Two of your three asset classes have drifted well past a reasonable 5-point threshold.
To get back to plan, you'd need to sell roughly $6,000 of stocks and use it to buy about $5,500 of bonds and $500 of crypto. Without seeing the actual dollar gap, most people either guess at a round number or skip rebalancing entirely because doing the math feels like too much friction.
The Bottom Line
Rebalancing isn't about predicting the market or timing the top of your winners. It's about making sure the risk you're carrying still matches the risk you actually chose — on purpose, on a schedule you control, not by accident because nobody was watching the drift.
Watchfolio's Rebalancing tool turns "am I still balanced?" from a spreadsheet chore into a two-second glance — with the exact trades to make when the answer is no.